How to Learn R as a Football Practitioner
This weeks newsletter has been produced in collaboration with Daniel Yu, Sport Scientist @ Orlando Magic.
As a football practitioner, you've probably noticed that coding is becoming a desirable skill to add as part of your CV when applying for jobs.
Nowadays, the vast amount of data collected in sports has made it crucial to have the ability to analyze and interpret this data.
Whether it's athlete profiling, injury risk assessment, or fatigue monitoring, teams need professionals who can leverage data to make informed decisions.
However, learning to code—especially in R—can feel overwhelming, particularly with its multitude of packages and functions.
To simplify your journey, I’ve outlined five essential steps that will help you master R, focusing on the most relevant packages and techniques.
Follow this guide to streamline your learning and focus on what really matters for a sport scientist.
Step 1: Download and Install R
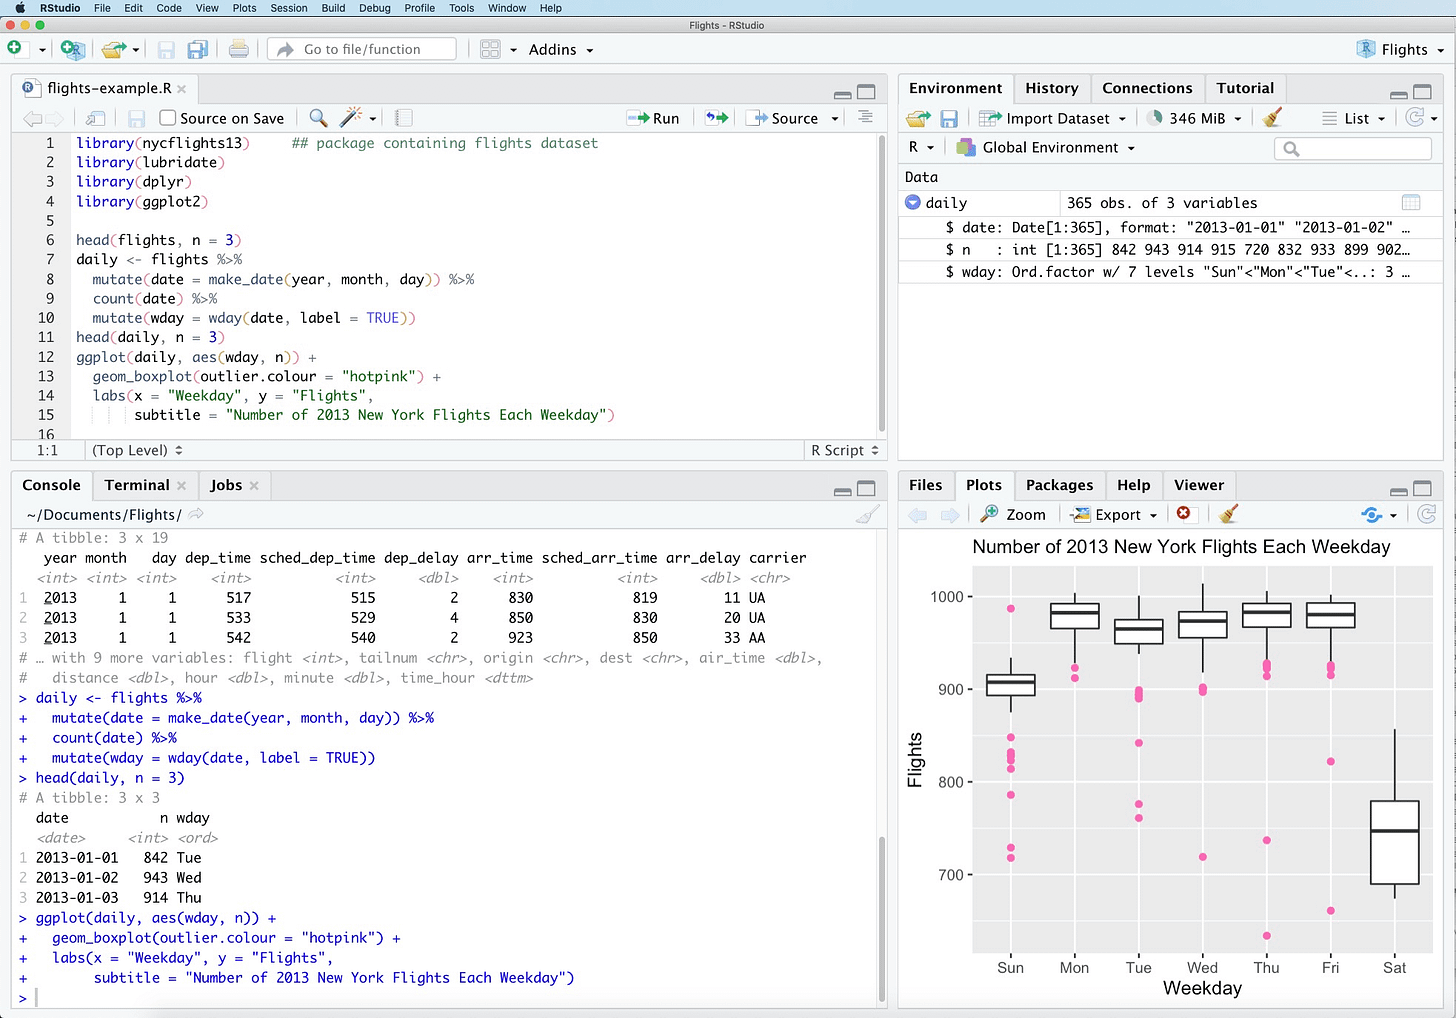
Start by installing R and RStudio, your primary tools for coding in R. Follow this link to download RStudio Desktop.
Congratulations! Taking this first step is often the hardest part. Many people know they need to learn R but keep delaying. You're already ahead of the curve by getting started.
Step 2: Learn to Clean and Wrangle Data
Data cleaning and wrangling make up 80% of the work in data analysis.
Mastering these skills will allow you to handle most tasks in sports science, from preparing data for analysis to making it meaningful.
To get started, focus on learning the key data manipulation functions in the dplyr package, which are often referred to as the five verbs of data manipulation:
● dplyr::arrange() – Sort data in ascending or descending order.
● dplyr::select() – Select specific columns to work with.
● dplyr::mutate() – Create new columns based on existing data.
● dplyr::filter() – Filter rows based on conditions.
● dplyr::summarise() – Create summary statistics and aggregate data.
Mastering these functions will empower you to prepare your data for effective analysis and visualization, making the rest of your work much easier.
Step 3: Master Data Visualization
Visualization is a powerful tool in sports science, allowing you to communicate insights effectively. Two of the most useful types of plots are:
1. Scatter plots – Great for identifying relationships between variables.
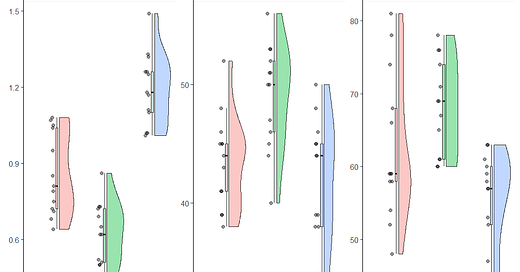
2. Raincloud plots – Ideal for visualizing distributions and individual data points.
Need some inspiration? Explore a variety of plot types and get free code at R Graph Gallery.
Step 4: Dive into Data Analysis
Once your data is clean, it's time for analysis. Sport scientists frequently use both descriptive statistics and predictive modeling to derive insights.
Start with descriptive statistics:
● Mean: base::mean()
● Maximum: base::max()
● Minimum: base::min()
● Standard deviation: stats::sd()
● Percentile rank: stats::quantile()
For more advanced analysis, you'll need to explore relationships between variables using correlations, linear regression, and mixed-effects models:
● Correlations: corrr::correlate()
● Linear regression: stats::lm()
● Mixed-effects models: lme4::lmer()
These techniques will help you understand performance trends, relationships between metrics, and how individual factors affect outcomes.
Step 5: Practice with Real-World Data
One of the best ways to solidify your skills is by practicing with real-world data. Working with data that’s relevant to your own interests will make learning more engaging and applicable to your career as a sport scientist.
Ready to Dive Deeper?
If you’re committed to learning R in just 5 weeks, check out our comprehensive course, "R for Sport Science." It covers everything you need to know, from basic data wrangling to advanced analytics.
By following these steps and focusing on the most essential skills, you'll be well on your way to master R and stand out in the field of sport science.
Already using R? Check out the Level 2 Course here.


